Originally posted on 2018
How to correctly measure energy savings from projects.
In this post we will see how to correctly measure energy savings generated after implementing an efficiency project.
We decide to implement an energy saving project.
The situation is that we have studied energy potentials. We have identified actions that can generate savings and we decide to implement a project with one of those ideas. The idea affects a specific area that we can measure separately, with the same accuracy, before and after the action. Let’s see the situation in a graph.
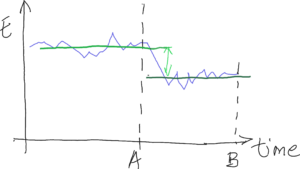
On the abscissa axis we represent the time, where A is when we implement the action and B is the end of the measurement. The ordinate axis is the energy consumed in the sector where we are going to implement the project.
Simple estimation: energy savings are the difference of the average energy before and after the action.

Unfortunately this approach reflects an error in most of the cases. The reason is that energy is influenced by variables that change from one period (A) to the other (B). Therefore we are not estimating correctly. For example, it is normal for energy consumption to be impacted by external temperature and humidity. So, what we have to do is build a theoretical model of the consumption, which takes into account the mentioned variables. The normal thing is to make the model through a regression.
Estimation error when energy is influenced by variables which change before and after the action.
I will dedicate another post to the topic of regressions. The type of correlation that I usually find is a linear regression. It may also be that there are exponential or other non linear types. So, if I find one that is not linear, I will share it with you in another post.
Real energy and predicted/theoretical energy
This is the shape that real energy (E) and theoretical energy (E’) have. The theoretical model adjusts to the real consumption.
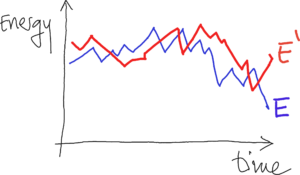
In such a way, that during the period, the total real and theoretical consumption are equal.

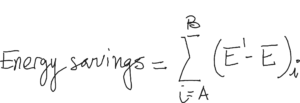
The savings of the project are the difference between the theoretical and the real energy consumption in period B.
Attention! To calculate the regression we can only use training data of the period from 0 to A (before the action). Reasoning: the theoretical model stores the old energy behavior. If we add data for the model after the implementation, we are contaminating the model.
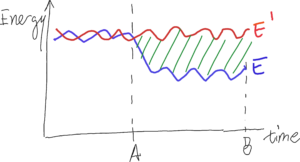
Small savings: use a CUSUM.
If the initiative generates small savings with respect to the measured energy, it is better to use a CUSUM graph. This chart detects small variations and cumulates them. It would look like this:

A recommendation along the measurement is to verify that in the two time periods that data is representative and has enough quality.