Squeezing the energy data
In this post we will make the most out of the energy data when this is scarce. For the example, let’s focus only on electricity and suppose that we only have the monthly bill from the electric company to our manufacturing plant. Of course, we also have the monthly production data.
Health check
The first step is to verify that the data is correct and representative. So what we will do is study it in absolute and in specific value. With these two magnitudes we can filter the information.

Specific energy consumption.
Specific indicators are calculated by dividing by weight (tons, kilos, etc.) or, if the product has a low density, in cubic meters (insulation, etc.). We divide, therefore, the consumption in kilowatts by the units produced.
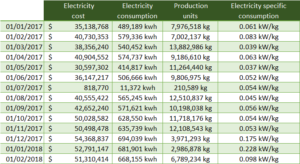
We represent the specific indicators and we will discard those values either very high or very low. Units are kilowatts per hour and per kilos.

In this example we see that the data from November 2017 to January 2018 has a very high specific consumption. It may be an error or the data may not be representative. Is better to remove this data from the set and study this deviation later.
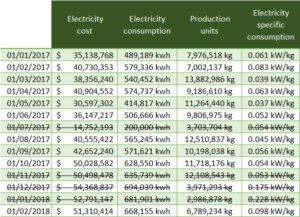
Absolute energy consumption.
In this case we represent the monthly data in kilowatts per hour and we will try to discover very high or very low values.

As we can see in July, the value is much lower than the rest of the months even though the specific value is similar to the average (we can not detect it in the specific chart). Likewise, for our study we will eliminate this data.
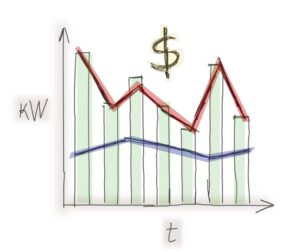
Estimating the fixed and variable consumption.
Fixed consumption is the energy expenditure necessary to maintain the activity of the manufacturing plant without producing any unit. The variables that influence it will be the number of days with activity and weather conditions. The variable consumption is the one to produce material units. The total consumption of the factory is the sum of the fixed and variable consumption.
Actually, it is an approximation. It is an iterative process to gain accuracy over time. I will describe two methods to determine the fixed and variable consumption. Classically, by clearing the unknowns in a formula or by linear regression using the entire data set. This last method is more accurate.
First method, classical method
The total energy is equal to the average daily fixed energy plus the variable one.
Et = Ef + Ev, where:
Et: total energy.
Ef: fixed energy, necessary for administrative and auxiliary services.
Ev: variable energy, necessary to produce.
In turn, the fixed energy is equal to the daily fixed energy by the number of days.
Ef = Efd x number of days per month, where:
Efd is the daily fixed energy.
I use the daily energy because not every month have the same days. That way we have more accuracy. If the weather is severe and there is a large variation between summer and winter, we will need additional energy to heat or cool. So we will have to take into account and use the historical climate data. In my example, I only consider the temperature, although we can also include humidity. As the consumption data are in a monthly basis we must find the data of the average monthly temperature in the vicinity of the manufacturing plant.
So the formula of the fixed energy will include in this case the temperature.
Ef = Efd x number of days per month + Ec x Average monthly temperature
Where, Ec is the energy needed to acclimatize the manufacturing center.
The monthly variable energy will depend on the units manufactured per month.
Ev = Energy per unit of product x number of production units
To determine our unknowns we need the same number of equations as there are unknowns. The unknowns are two and we had 14 months. Since we have ruled out 3 months after the quality filter, we still have enough to find the unknowns.
Second method, linear regression.
If we have enough monthly data we can reduce the error of the classical estimate using all the data which is available. A multivariable linear regression can be executed where the dependent variable is the energy consumed and the independent variables are the fixed daily consumption and the variable consumption of production.
To execute the linear regression, we will take as the range of the dependent variable the column of the total energy consumption and as a range of the independent variable the columns with the monthly days and the monthly units produced.
The final result will be similar to the following:
Et = k1 + Efd x days + Ec x Temperature + Ev x Units production.
Convert consumption data to power
Then we will convert the energy data to power data, simply dividing by the work time. As we are doing an average we will consider that each day has 24 hours and that these are the hours worked. When we have an individual meter daily data, we can fine tune our calculations and divide only by the hours actually worked.
Finally, we will talk about total power equal to fixed power plus variable power. With power units we gain in visibility. We can compare the power consumed with that of the inventory list (power of installed equipment).

Applications of what has been learned
Prioritization of saving actions
Now that we know the magnitude of the fixed power and the variable power, we can prioritize which one to work with first. One criterion is to start with the highest power. As we gain knowledge, we will focus our efforts more efficiently.
Estimation of consumption deviations
We can calculate what is the theoretical consumption of a month if we know what is the average monthly temperature and the days worked. With the formula we have determined, we calculate the necessary energy and compare it with the one actually used. Any difference is a deviation.
Monthly peaks
If the electricity company tells us in the invoice what was the peak power consumed in the month we can compare it with the average power. A big difference can be a reason to start a peak reduction project.
Monthly peaks at peak hours
It is possible that even the company tells us what was the peak during peak billing hours. They are time slots that are heavily penalized in terms of cost. We can also reduce our energy expenditure by reducing these specific peaks. They are usually produced by an overlap of several equipment powers. Proper management of the start-up of the factory can reduce these peaks and thus energy expenditure.
Final conclusion
The final conclusion is that we must exploit to the maximum the information that we have. The more knowledge we have of the energy needed in the process and its activities, the easier we can determine the saving measures and consume less energy. We could decide to install at least a general counter with which to have daily hourly data. This information will make them complete more accurately what the fixed load is and what the variable load is. In addition, we can discover when power peaks are occurring and try to eliminate them.