Data discrimination.
In this article I will talk a little more about theoretical consumption, about normalization of energy values influenced by known variables. Specifically, how data should be discriminated when consumption patterns are different in for particular data groups.
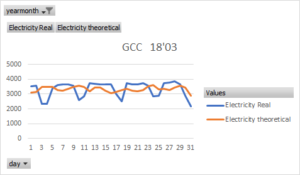
By performing this step prior to the execution of the regression we will have greater accuracy in our model. We can see the difference with the following two graphs. The below graph shows the real and theoretical electrical consumption with non-discriminated data.
Then, below, again the theoretical consumption but calculated after discriminating the original data according to whether they are working or not in a building, production site or cluster.
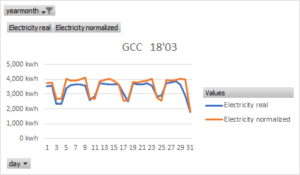
The data package must be classified if there are certain patterns in certain data groups such as working days, weekends, working hours, etc. In my case I have segregated according to the previous criteria and I have gained in accuracy in my model. The achievement in accuracy is confirmed in the graph where the theoretical is closer to the real and follows its variations. In addition, the square R regression coefficient (R2) also increases.
The disadvantage of this technique is that the data processing time is longer and the files are less manageable. But this disadvantage is compensated by the accuracy increase. As already commented in previous articles, having a theoretical is very useful to detect deviations or to measure energy savings (also read How to correctly measure…).
Next, we can see a graphic representation of the process to group of the data: dependent variable (energy consumed) and independent variables (temperature, humidity, presence, production, etc.). These last can come from an automatic data collection system or from short term measurements during tests. First, a check of the consistency of the original data is made. The erroneous data such as voids (for example, by system disconnection) or aberrant values (very high, very low or negative) are eliminated. Then we arrange depending on whether it is a working day or weekend and we will obtain two data packages. Later, we divide again the pack with the working days in two groups: working hours and non-working hours.
The reasoning behind is that surely the energy consumption is or should be different in each of the studied aggregations. It is assumed that in the non-working hours or on weekends many systems can change their regulation or be disconnected.
Theoretical modelling or normalization allows to compare the real data in a more correct way. I usually calculate them using multilinear regressions (more than one dependent variable). Over time the models are refined, gaining in accuracy. I normally make a model for each energy in a building or cluster (production line, .etc.): electricity, gas, hot water, water coolant, etc. Then I compare them with the real values of each energy.
With the data packages generated in the discrimination we perform the regressions and we will have a normalized energy for each period. The model will follow more accurately the real value.