Air compressors audit
One of the areas with high energy consumption is the generation, distribution and use of compressed air. It is very important to design the system in an optimal way with reliable data of the necessary consumption and its conditions (necessary pressure, average flow, peak flow). This task is often complicated because only estimates and not real data is available. Many times, the tendency is to oversize the system for fear of not having the minimum supply or just expecting production increases.
Over consumption and malfunctioning
But this situation can generate over consumption and malfunctioning during future operation. If the system is over-sized, the equipment will work in an inefficient area and will also have more stops and starts than the optimal ones. Another undesired effect will be the time when the compressors work without demand, to recover. Let’s see if an air compressors audit can detect the above mentioned problems.
Therefore, it is surely necessary to perform an audit of the compressed air system once production has stabilized to know how it works. So, I will explain the result of an audit of a compressed air generation system in one factory.
Approach: technical projects or inventory list.
The study of the air generation system is commonly covered with two tools of the energy program explained in a previous post: technical projects and inventory list. In the first case because it is usually the department of engineering or services who is concerned with the optimization of supplies of auxiliary services for production and generally has a technical expert with greater knowledge of compressed air. But another way to cover the problem is through the inventory list. That is, checking what are the technical characteristics of the equipment and its efficiency. A comparison is established, and the operating mode is changed to a more efficient one.
Installation.
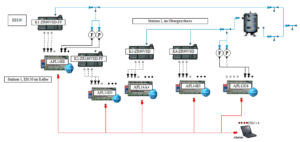
To better understand the process I will describe the installation. These are two compressed air production stations that feed each of them to two supply circuits that, in turn, are joined by a distribution pipeline.
- Station 1. Manufacturer Atlas Copco, model ZR90VSD-FF (K1) and ZR160VSD-FF (K2).
- Station 2. From the manufacturer Atlas Copco, two models ZR90VSD (K3 and K4). These two compressors feed a buffer tank.
Each station has a programmable equipment that regulates the mode of operation.
External audit.
The audit was carried out externally since the factory did not have the necessary measuring devices. The period of time measured was one week to be able to distinguish between the daily operation and that of the weekend. As a result, it was found that the average air flow required was 300 L/s. The pressure at the outlet of the compressors in the distribution ring was 6.7 bar but with a margin of 0.3 bar. The general programmer had the following working operation: K1 + K3 one week and the next one K2 + K4. Using a compressor from each station is coherent to have a more balanced system, given the considerable length of the distribution pipe. However, it was found that K3 and K4 were limited to 65% of their capacity, working in an inefficient zone. The original reason was to restraint the total flow but the solution adopted was not positive. It was also found that station 1 had as priority the operation of K1 and then that of K2.
It was also verified that the connecting pipe of the two circuits had the adequate diameter because there were some doubts.
Analysis of the data: easier by representing efficiency.
To avoid getting lost in the sea of data provided by the audit, I recommend representing the efficiency of the compressors in one single graph. This is the fastest way to check the current status and determine the optimum. Therefore, the auditor was required to measure the current performance curve of each equipment. These are the results:
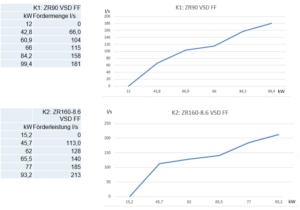

With these data we calculate the specific consumption in kWh/m3, dividing the power consumed by the produced air flow.

By the way, it is convenient that the efficiency of the equipment is measured in a sufficient number of points and that they are the same for all the compressors. This allows us to later compare the data more easily, using a single graph.

Unfortunately, this was not the case, so I had to use extrapolation and interpolation tools to adapt the data, to normalize it.

At the bottom of the article, I leave a link with information on how to do extrapolation and interpolation with Excel.
Conclusion.
In conclusion, it can be said that although the compressors have speed drivers, which ameliorate efficiency, there is still room for improvement. Each compressor, although having the same theoretical characteristics, has a different curve (specific consumption). These curves are not perfect and sometimes a compressor is more efficient in the lower part of production, while another is more efficient in the upper part of production. It is easier to compare the efficiency of the compressors in the same graph and thus determine which has to be the most optimal operating sequence.
The final result is a change in the working mode in such a way that the most efficient compressor is the first to work. When it reaches its maximum flow (200 L/s) then the second most efficient of the 3 similar ones will come into operation. This is compressor K4, which is more efficient in the lower part of operation up to (100 L/s). K3 will be a backup equipment and K1 can be disconnected permanently. This involves reducing the global specific consumption from the current value of 0.156 kwh/m3 to 0.115 kwh/m3.
Quantification of savings.
This represents an annual saving of 12,000 euros.
Additionally, the working pressure is reduced from 6.7 bar to 6.5 bar. As the saving ratio is 0.7% per 0.1 bar reduction, the saving in money represents another 2,000 euros. And the time when compressors is unloaded has decreased from 7% to 2%.
In this system optimization we are in the field fine tuning and not of redesign since the size of the compressors and their efficiency is very close to the required by production.
Data interpolation in Excel.
https://www.datadigitization.com/dagra-in-action/linear-interpolation-with-excel/
Data extrapolation in Excel.
https://corporatefinanceinstitute.com/resources/excel/functions/forecast-trend-extrapolate-excel/