Energy map.
In this post I develop one of the tools that made up the energy program which I proposed in the An energy program post: an energy map. The question is how to locate the different types of energy according to consumers and with a certain degree of accuracy. We need this basic information to know where to act, to identify important consumers. Once we have the energy map we can calculate energy indicators for consumers. With them we will study their behavior and detect which are the variables that regulate consumption. The indicators will be represented in dashboards where we will discover deviations and potentials.
The following graph describes a site with several office and production buildings. There are two supply points of two types of energy. The two energies are distributed to all the buildings. After having this detailed information you can build the indicators and dashboards. From the analysis of the dashboards we will have buildings or areas with deviations and others that have a good behavior.
Coverage degree.
It is not necessary that the degree of coverage (measured energy divided by total energy) is 100% when we start the energy program. This depends on the priorities established on it. I will also describe a method to achieve a good balance between coverage, economy and speed of implementation: the use of clusters.
Clustering.
The philosophy is to go from the top to the bottom where top is supplier total energy invoice and bottom is complete counters deployment (100% coverage). That is, instead of massively installing meters in all the machines, we first install in certain areas.
We start from the boundaries of the company. In this case, the power supply points are included. And we also have the monthly consumption through the invoices from energy distributors. This is our first cluster. The next step is to divide this cluster into more units. Divisions are made according to the importance they have. This can be determined with the theoretical consumptions, with the nominal powers of the equipment in those areas.
Clustering properties:
⇑ Deployment time.
⇑ Prioritizing.
⇑ Economy.
⇓ Accuracy.
With the cluster philosophy, we gain in coverage as we expand the process and the number of counters increases. It allows us to gain a vision of the big consumers before full coverage and to know in which direction to continue with the clustering. This process is faster than a large implementation of meters and gives an order of magnitude of the main consumers and their location. We can design primary energy indicators that we will later decompose into more detailed ones. But these first ones can be useful to detect large deviations or potentials.
Virtual counters.
We will also use virtual counters. In the following picture we have an example of how we can use virtual counters. The V-03 counter will be the difference between the consumption that comes to this node and the one measured by the other two following meters.
Where V-03 = R-00 – (R-01 + R-02)
Accuracy loss.
There is a loss of accuracy since if a counter could be wrong and it transmits the error to the virtual one. But in many cases the savings are measured by means of a single meter with a given error that can be the same before and after the saving project.
With the help of clustering and virtual counters, we will quickly have a detailed map of the consumption of the different types of energy along the limits of the company.
Energy indicators.
The next stage is to design energy indicators. These have to be absolute and specific because the information and conclusions extracted are different. Absolutes are those that measure absolute consumption, for example, kWh of electricity consumed by a building. Specific are the result of dividing the absolutes by the appropriate production units in that building or area. That is, if it is a production building that delivers intermediate or final units of certain defined products. These are our production units.
Therefore, the specific indicator will be, for example, the kWh/t, the absolute consumption in kWh divided by the tons of intermediate or final product. The unit of process depends on the activity that occurs. It can be final product without packing, packed, etc.
Dashboards.
The indicators are special for each area. Once we track the evolution of the indicators over the time we try to understand their behavior. The variables that affect on it must be determined. For example, external climatic conditions, process time in each determined activity (mixing, heating, cutting, cooling), etc. Once the pattern is known, we will determine a baseline to compare with the real data. A simple reference are the past values, the historical data. The problem is that many variables are not kept constant and the past data is not valid. For example, if climatic conditions have influence, we can only compare consumption data when these conditions are constant.
Graphic interface and right energy indicators.
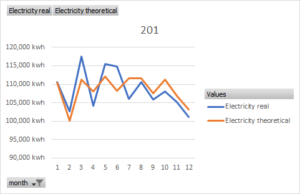
The best way to detect deviations and potentials is by means of dashboards, graphically. We can draw the baseline and the real one. Any real value higher than baseline value is potentially an anomaly. I recommend representing the different types of energy and the total sum, to simplify.
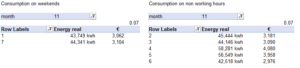
Summing different types of energies is an approximation as they are not equivalent. One way to avoid this error is to transform this consumption into cost, to monetize. We transform the energies into cost and then we add up them to have the total. Other graphs of interest are the hourly consumption, during working and non-working hours or weekdays and weekends. We can have control panels with the values of a specific meter. We do this to measure concrete savings from a project in which we have identified the measurement point.