Fault detection (automatic).
In this article, I am going to talk about fault detection (automatic) due to their impact on energy consumption. This is a previous step to fine-tuning or redesign (described in my fine-tuning article). It is based on the assumption that the systems may not be working properly. So, before optimizing the system or changing it completely we must detect and repair those errors. These deviations can be detected through a commissioning that can be classified as visual or automatic. Visual would be a visit to the facilities in search of failures in measuring devices (temperature sensors damaged, etc.), control (controllers, etc.) or elements (leak from a valve, etc.). Automatic commissioning uses algorithms that work on the collected data by the building management system. In this article I focus on the description of the automatic commissioning.
I’m going to use a practical example to understand the concept. Let us suppose that within our park of buildings we have a system which controls the internal environmental. It supplies hot water to the static heating system. It is composed of a boiler that generates hot water, a buffer tank and two pumps which send the hot water to the different static emitters. The control system collects the values of certain variables (external temperature, day of the week and current hour) and calculates the required temperature of the hot water circuit (controlled variable).
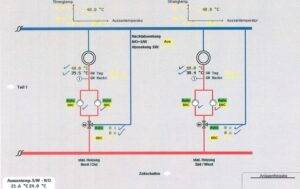
In the previous image we can see two twin systems that feed two areas of the building with different solar radiation. Each system has two pumps in parallel and a three-way valve to replenish with cold water and to feed with hot water. The valve and the pumps work according to the temperature of the circuit that is necessary. We see two values: the required temperature (40 ºC, controlled variable) and the actual temperature (39.5 ºC).
The control system is explained by the following image:
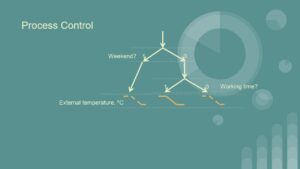
The ordinate represents the required temperature and the abscissa axis the external temperature. When the external temperature is less than 3 ºC the required temperature is 65 ºC. When the external temperature is higher than 20 ºC the required temperature is 40 ºC. Between 3 and 20 ºC the required temperature follows a linear function. But if we find ourselves in non-working hours and on weekends the required temperature decreases by 10 ºC.
To apply the automatic detection I developed an algorithm that I programmed in visual basic (at the end of the article I upload the code and the original file). The data set comes from the building management system (BMS). The program classifies the data according to whether we are on weekends or not. Subsequently, it classifies the working days between working hours and non-working hours. Each of the three classified data packages is assigned the corresponding control curve.
The field of fault detection (automatic ) is very broad and to cover it we have to generate the algorithms depending on the data from system and our knowledge. In the example I compare the required temperature with the actual temperature (Offset error graph) and I also compare the required temperature calculated by the control system with the one calculated by me (Control error graph).
The results of the first comparison show that there are many situations in which the required temperature is different from the actual temperature. All these conditions represent an opportunity that has an impact on energy consumption.
Offset error graph, fault detection (automatic)
The results of the second comparison also show that the temperature calculated by the control system is not correct in many cases.
Control error graph, fault detection (automatic)
Once the errors are detected, they must be corrected using different strategies in each case. We can quantify the failures. The correction of them mean an energy saving. We can measure the saving, for example, following the indications in the article how to correctly measure the savings from a project.
Below, I leave the programed algorithm and the original file with the data set.